Running anglemania with Seurat
2025-05-14
Source:vignettes/anglemania_tutorial_Seurat.Rmd
anglemania_tutorial_Seurat.RmdIntroduction
anglemania is a feature selection package that extracts genes from multi-batch scRNA-seq experiments for downstream dataset integration. The goal is to select genes that carry high biological information and low technical noise. Those genes are extracted from gene pairs that have an invariant and extremely narrow or wide angle between their expression vectors. It improves conventional usage of highly-variable genes for integration tasks, especially when the transcriptional difference between cell types or cell states is subtle (showcased here with de.facLoc set to 0.1 (= mild differences between “Groups”)). anglemania can be used on top of SingleCellExperiment or Seurat objects.
suppressPackageStartupMessages({
  library(anglemania)
  library(dplyr)
  library(Seurat)
  library(splatter)
})
## Warning: replacing previous import 'S4Arrays::makeNindexFromArrayViewport' by
## 'DelayedArray::makeNindexFromArrayViewport' when loading 'SummarizedExperiment'Create simulated data
batch.facLoc <- 0.3
de.facLoc <- 0.1
nBatches <- 4
nGroups <- 3
nGenes <- 5000
groupCells <- 300

sim <- splatSimulate(
    batchCells = rep(groupCells * nGroups, nBatches),
    batch.facLoc = batch.facLoc,
    group.prob = rep(1/nGroups, nGroups),
    nGenes = nGenes,
    batch.facScale = 0.1,
    method = "groups",
    verbose = FALSE,
    out.prob    = 0.001,
    de.prob     = 0.1, # mild
    de.facLoc   = de.facLoc,
    de.facScale = 0.1,
    bcv.common  = 0.1,
    seed = 42
)

se <- CreateSeuratObject(counts = counts(sim), meta.data = as.data.frame(colData(sim)))
## Warning: Data is of class matrix. Coercing to dgCMatrix.
# rm(sim)
se
## An object of class Seurat
## 5000 features across 3600 samples within 1 assay
## Active assay: RNA (5000 features, 0 variable features)
## 1 layer present: counts
Layers(se)## [1] "counts"
Seurat::Assays(se)## [1] "RNA"
head(se[[]])## orig.ident nCount_RNA nFeature_RNA Cell Batch Group ExpLibSize
## Cell1 SeuratProject 47324 3707 Cell1 Batch1 Group1 46898.14
## Cell2 SeuratProject 54908 3850 Cell2 Batch1 Group1 54688.18
## Cell3 SeuratProject 51501 3799 Cell3 Batch1 Group2 52027.93
## Cell4 SeuratProject 52272 3862 Cell4 Batch1 Group1 52319.47
## Cell5 SeuratProject 37808 3569 Cell5 Batch1 Group3 37774.72
## Cell6 SeuratProject 58801 3843 Cell6 Batch1 Group3 58112.35unintegrated data
se_unintegrated <- se
suppressWarnings({
  se_unintegrated <- se_unintegrated %>%
  NormalizeData() %>%
  FindVariableFeatures() %>%
  ScaleData() %>%
  RunPCA() %>%
  RunUMAP(dims = 1:30, verbose = FALSE)
})
## Normalizing layer: counts## Finding variable features for layer counts## Centering and scaling data matrix## PC_ 1
## Positive: Gene1367, Gene2172, Gene1089, Gene2598, Gene4513, Gene587, Gene789, Gene1951, Gene503, Gene898
## Gene75, Gene2149, Gene2864, Gene217, Gene394, Gene2276, Gene2803, Gene1839, Gene1716, Gene922
## Gene1226, Gene1075, Gene821, Gene4796, Gene3864, Gene3930, Gene1128, Gene2980, Gene3851, Gene4143
## Negative: Gene4168, Gene716, Gene1947, Gene4044, Gene920, Gene550, Gene266, Gene2145, Gene1540, Gene4026
## Gene4717, Gene4097, Gene303, Gene3369, Gene3528, Gene273, Gene3075, Gene1476, Gene3361, Gene1049
## Gene4700, Gene2991, Gene310, Gene4101, Gene307, Gene3739, Gene4720, Gene268, Gene797, Gene2748
## PC_ 2
## Positive: Gene1147, Gene4978, Gene4045, Gene3516, Gene2718, Gene449, Gene4265, Gene1735, Gene2672, Gene4324
## Gene2713, Gene3520, Gene921, Gene807, Gene761, Gene2933, Gene141, Gene4864, Gene1756, Gene1878
## Gene3461, Gene1829, Gene2879, Gene3232, Gene3671, Gene3658, Gene381, Gene1859, Gene2435, Gene75
## Negative: Gene844, Gene4871, Gene3069, Gene487, Gene2671, Gene3600, Gene3683, Gene772, Gene4390, Gene33
## Gene825, Gene2072, Gene1494, Gene1699, Gene3854, Gene4601, Gene3663, Gene2104, Gene4879, Gene2541
## Gene3345, Gene3387, Gene4256, Gene3386, Gene3639, Gene4237, Gene3337, Gene2033, Gene3430, Gene3325
## PC_ 3
## Positive: Gene4379, Gene785, Gene3409, Gene1985, Gene3609, Gene3527, Gene1888, Gene3256, Gene1862, Gene2306
## Gene1415, Gene498, Gene3431, Gene194, Gene3945, Gene1439, Gene352, Gene2568, Gene901, Gene2068
## Gene3309, Gene1503, Gene3510, Gene3026, Gene1173, Gene4609, Gene2498, Gene1977, Gene862, Gene1272
## Negative: Gene3375, Gene510, Gene3543, Gene4623, Gene512, Gene2878, Gene224, Gene2465, Gene158, Gene3732
## Gene1732, Gene1331, Gene4316, Gene4530, Gene2909, Gene880, Gene4872, Gene3762, Gene1567, Gene4244
## Gene3298, Gene2382, Gene3000, Gene54, Gene196, Gene683, Gene1090, Gene1159, Gene3965, Gene4326
## PC_ 4
## Positive: Gene2249, Gene3443, Gene3527, Gene71, Gene2586, Gene1167, Gene3670, Gene368, Gene3594, Gene4908
## Gene3933, Gene1762, Gene842, Gene4562, Gene394, Gene2133, Gene2230, Gene3718, Gene876, Gene1452
## Gene4025, Gene114, Gene1616, Gene2547, Gene3955, Gene2619, Gene2533, Gene206, Gene3890, Gene575
## Negative: Gene3900, Gene650, Gene854, Gene1761, Gene4723, Gene477, Gene2307, Gene3566, Gene2816, Gene3031
## Gene3629, Gene3551, Gene4966, Gene4342, Gene2144, Gene4904, Gene4368, Gene1026, Gene2907, Gene3115
## Gene2223, Gene2350, Gene1295, Gene960, Gene3112, Gene3069, Gene2855, Gene2780, Gene4066, Gene3024
## PC_ 5
## Positive: Gene4030, Gene3767, Gene1452, Gene2575, Gene4562, Gene3762, Gene3185, Gene687, Gene3069, Gene2444
## Gene3157, Gene4018, Gene4784, Gene2569, Gene2685, Gene4368, Gene3031, Gene3040, Gene3115, Gene2149
## Gene4860, Gene2907, Gene3817, Gene671, Gene2405, Gene3442, Gene591, Gene4010, Gene1690, Gene3229
## Negative: Gene394, Gene898, Gene650, Gene447, Gene3050, Gene3908, Gene1167, Gene2159, Gene4543, Gene3527
## Gene93, Gene4557, Gene71, Gene2803, Gene2162, Gene1828, Gene2586, Gene3365, Gene3609, Gene857
## Gene3933, Gene4025, Gene4744, Gene1482, Gene799, Gene4711, Gene3176, Gene842, Gene875, Gene3201
DimPlot(se_unintegrated, reduction = "umap", group.by = "Batch")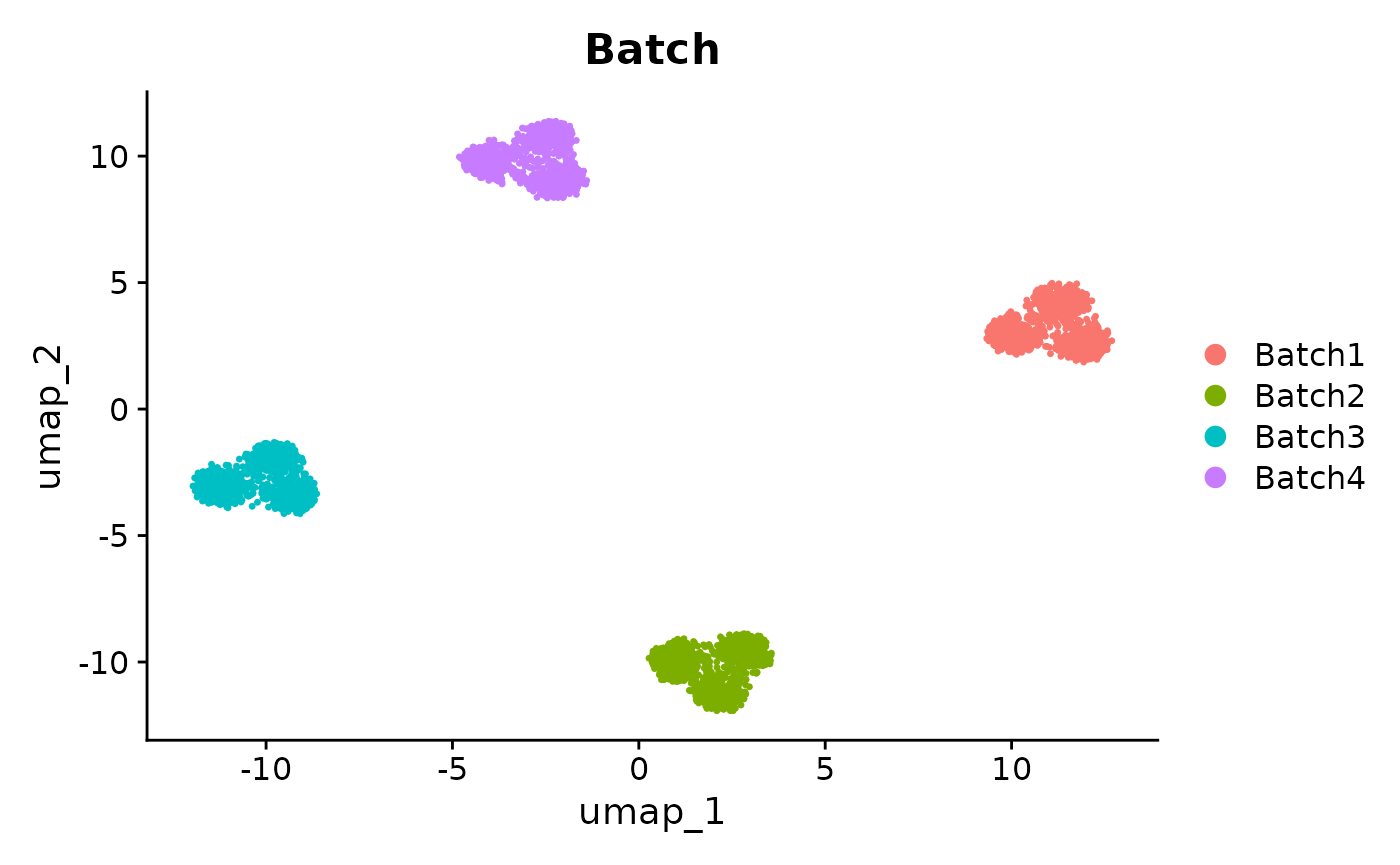
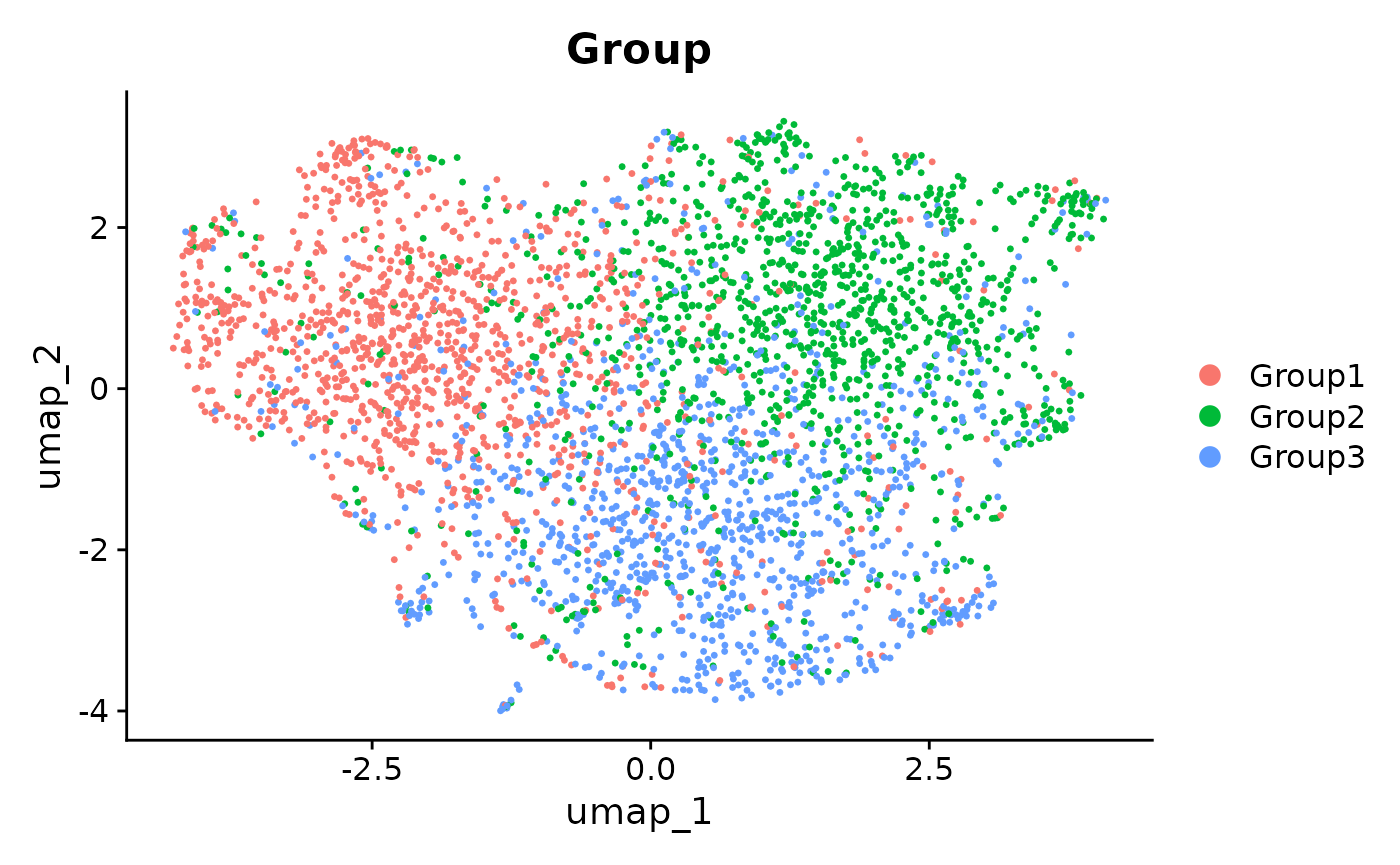
DimPlot(se_unintegrated, reduction = "umap", group.by = "Group")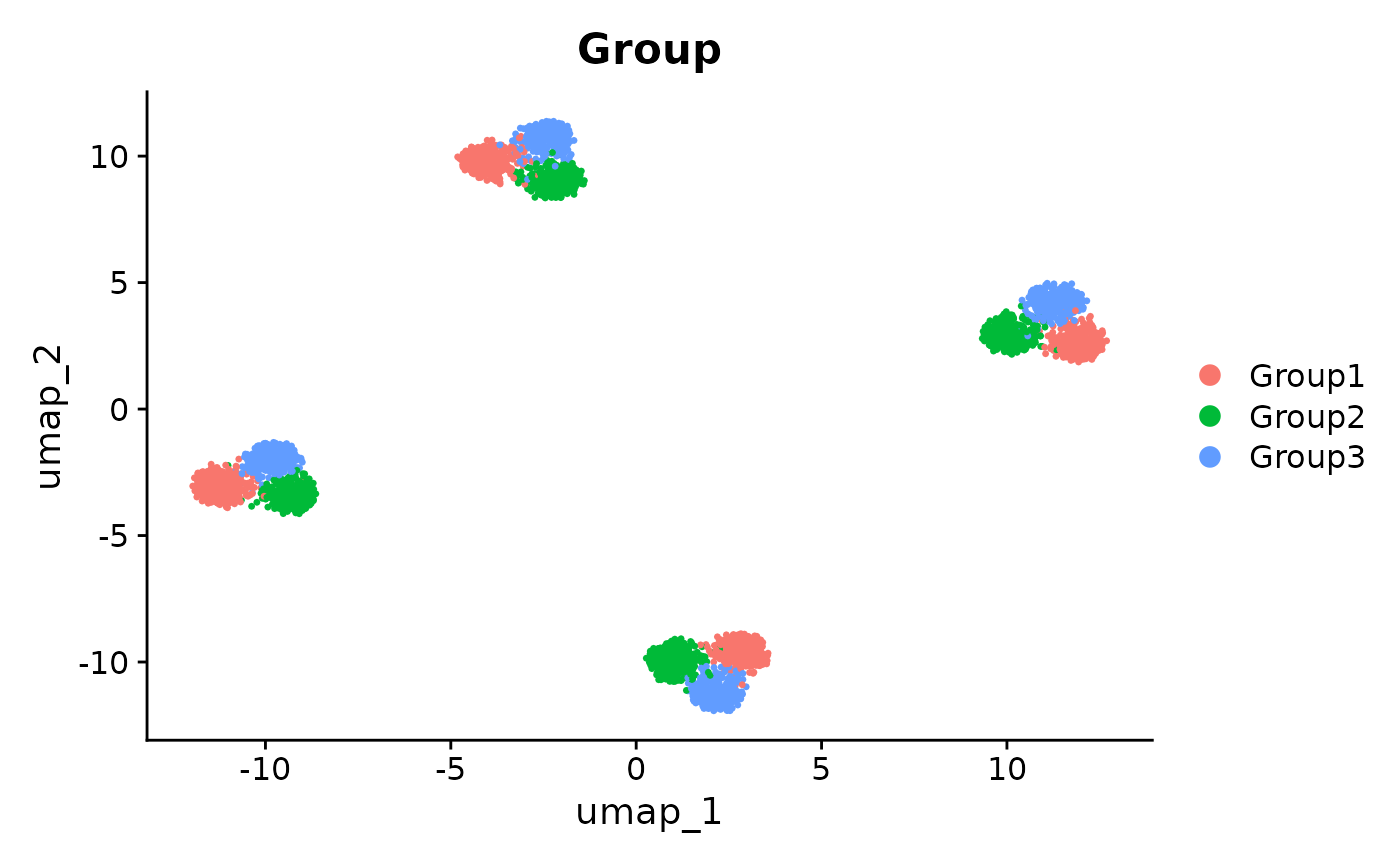
run anglemania
create anglemania object
- We create an anglemania object to have a standardized input to the
anglemania function
- It can be created from:
- An SingleCellExperiment (SCE) object
- Seurat object
- a list of SCE and/or Seurat objects
- It can be created from:
- pre-requisites are that you:
- have a column in the metadata (colData for SCE) that specifies the batch/sample a cell belongs to
- or if you pass a list of SCE/Seurat objects, just provide this as the input and don’t specify a batch key
head(se[[]])## orig.ident nCount_RNA nFeature_RNA Cell Batch Group ExpLibSize
## Cell1 SeuratProject 47324 3707 Cell1 Batch1 Group1 46898.14
## Cell2 SeuratProject 54908 3850 Cell2 Batch1 Group1 54688.18
## Cell3 SeuratProject 51501 3799 Cell3 Batch1 Group2 52027.93
## Cell4 SeuratProject 52272 3862 Cell4 Batch1 Group1 52319.47
## Cell5 SeuratProject 37808 3569 Cell5 Batch1 Group3 37774.72
## Cell6 SeuratProject 58801 3843 Cell6 Batch1 Group3 58112.35
batch_key <- "Batch"

angl <- create_anglemania_object(se,
  batch_key = batch_key,
  min_cells_per_gene = 1,
  seurat_assay = "RNA"
)
## No dataset_key specified.
## Assuming that all samples belong to the same dataset and are separated by batch_key: Batch## Using the intersection of filtered genes from all batches...## Number of genes in intersected set: 4964## Extracting count matrices...## Filtering each batch to at least 1 cells per gene...
angl## anglemania_object
## --------------
## Dataset key: NA
## Batch key: Batch
## Number of datasets: 1
## Total number of batches: 4
## Batches (showing first 5):
## Batch1, Batch2, Batch3, Batch4
## Number of intersected genes: 4964
## Intersected genes (showing first 10):
## Gene1, Gene2, Gene3, Gene4, Gene5, Gene6, Gene7, Gene8, Gene9, Gene10 , ...
## Min cells per gene: 1run anglemania function
- the anglemania function has five arguments
- the input anglemania object
- method: either cosine, spearman or diem
- this is the method by which the relationship of the gene pairs is measured. Default is cosine,
- zscore_mean_threshold: We compute a mean of the zscore of the relationship between a gene pair, and then we set a minimal cutoff for the (absolute) mean zscore. A cutoff of 2 means that the filtered gene pairs have a relationship, e.g. cosine similarity, that is 2 standard deviations away from the mean of all cosine similarities from this dataset. A higher value means a more stringent cutoff.
- zscore_sn_threshold: The SN or signal-to-noise ratio measures the invariance of the relationship of the relationship between the gene pair. A high SN ratio means that the relationship is constant over multiple batches.
- max_n_genes: you can specify a maximum number of extracted genes. They are sorted by decreasing mean zscore
angl <- anglemania(angl,
  zscore_mean_threshold = 2,
  zscore_sn_threshold = 2,
  max_n_genes = 2000 # optionally define a max number of genes.
)
## Computing angles and transforming to z-scores...## Creating directory "/tmp/RtmpBcd8rs/file1f4f71686af1" which didn't exist..## Creating directory "/tmp/RtmpBcd8rs/file1f4fa6217aa" which didn't exist..## Creating directory "/tmp/RtmpBcd8rs/file1f4f6752c4e4" which didn't exist..## Creating directory "/tmp/RtmpBcd8rs/file1f4f19997299" which didn't exist..## Computing statistics...## Weighting matrix_list...## Calculating mean...## Calculating sds...## Filtering features...## Selecting features...## [1] "Selected 1496 genes for integration."
angl <- select_genes(angl,
                     zscore_mean_threshold = 2.5,
                     zscore_sn_threshold = 2.5)
## [1] "Selected 306 genes for integration."
# Inspect the anglemania genes
integration_genes <- get_anglemania_genes(angl)
head(integration_genes)
## [1] "Gene394" "Gene3527" "Gene71" "Gene5000" "Gene1055" "Gene4201"
length(integration_genes)## [1] 306integration
- we implemented the easy-to-use integrate_by_features() function from the anglemania package which uses Seurat CCA integration
- you can also just use the anglemania genes for other integration algorithms
# if the Seurat FindIntegrationAnchors() function does not work,
# change this to the specified size:
options(future.globals.maxSize = 4000 * 1024^2)
suppressWarnings({
  seurat_integrated_angl <- integrate_by_features(se,
    angl,
    process = TRUE
  )
})
## Log normalizing data...## Finding integration anchors...## Integrating samples...## Running PCA with 30 PCs## Running UMAP with 30 PCs and 30 neighbors
seurat_integrated_angl## An object of class Seurat
## 5306 features across 3600 samples within 2 assays
## Active assay: integrated (306 features, 306 variable features)
## 2 layers present: data, scale.data
## 1 other assay present: RNA
## 2 dimensional reductions calculated: pca, umap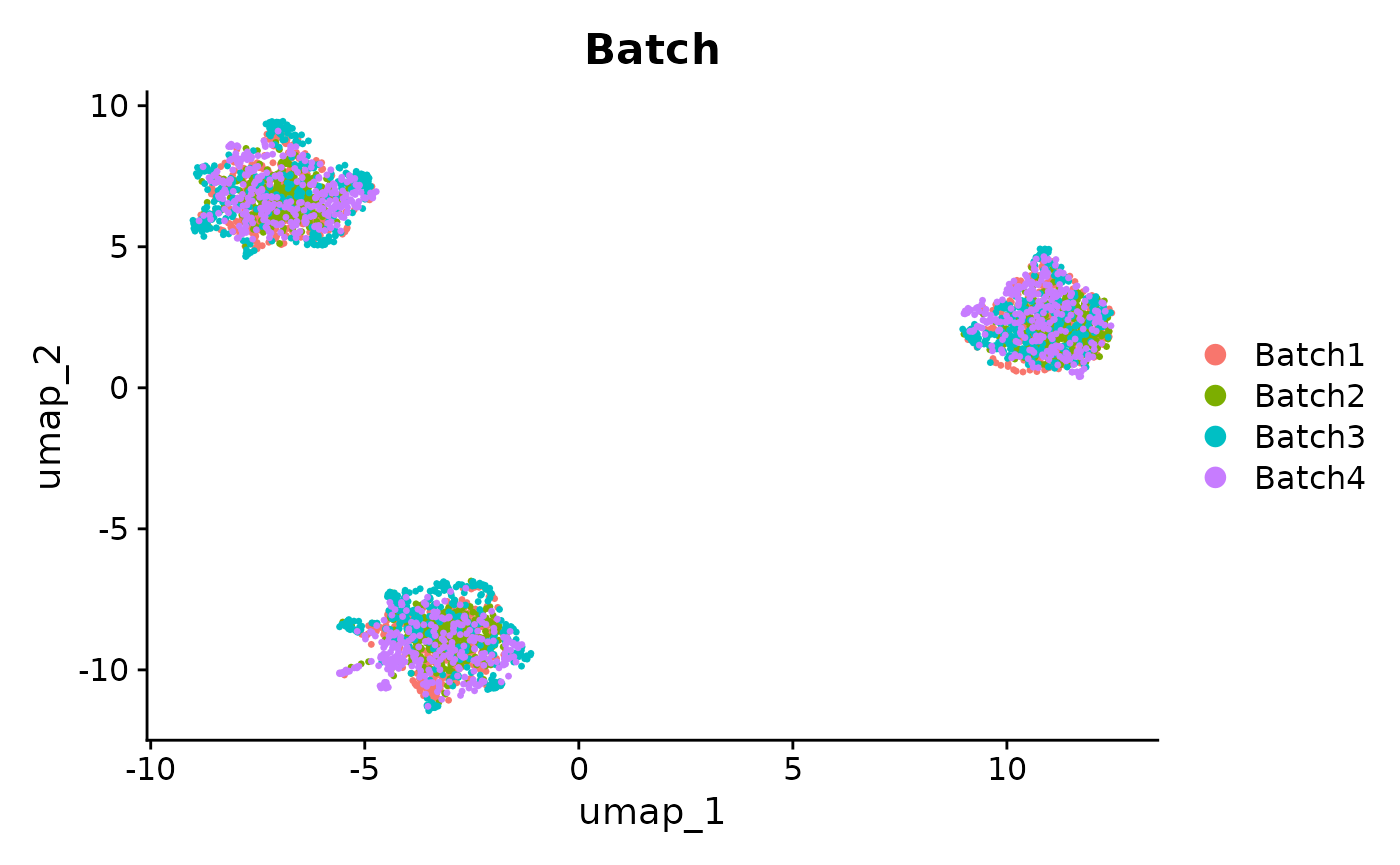
Comparison to using HVGs
using HVGs
get HVGs
se_list <- SplitObject(se, split.by = batch_key)
se_list <- lapply(se_list, NormalizeData)
## Normalizing layer: counts
## Normalizing layer: counts
## Normalizing layer: counts
## Normalizing layer: counts
# anglemania chose only 324 genes based on the thresholds
#   to make it comparable we only choose 324 highly variable genes:
hvg_features <- Seurat::SelectIntegrationFeatures(se_list, nfeatures = 324)
## No variable features found for object1 in the object.list. Running FindVariableFeatures ...## Finding variable features for layer counts## No variable features found for object2 in the object.list. Running FindVariableFeatures ...## Finding variable features for layer counts## No variable features found for object3 in the object.list. Running FindVariableFeatures ...## Finding variable features for layer counts## No variable features found for object4 in the object.list. Running FindVariableFeatures ...## Finding variable features for layer countsintegration
suppressWarnings({
  seurat_integrated_hvg <- integrate_seurat_list(se_list,
    features = hvg_features,
    process = TRUE
  )
})
## Log normalizing data...## Finding integration anchors...## Integrating samples...## Running PCA with 30 PCs## Running UMAP with 30 PCs and 30 neighbors
seurat_integrated_hvg## An object of class Seurat
## 5324 features across 3600 samples within 2 assays
## Active assay: integrated (324 features, 324 variable features)
## 2 layers present: data, scale.data
## 1 other assay present: RNA
## 2 dimensional reductions calculated: pca, umap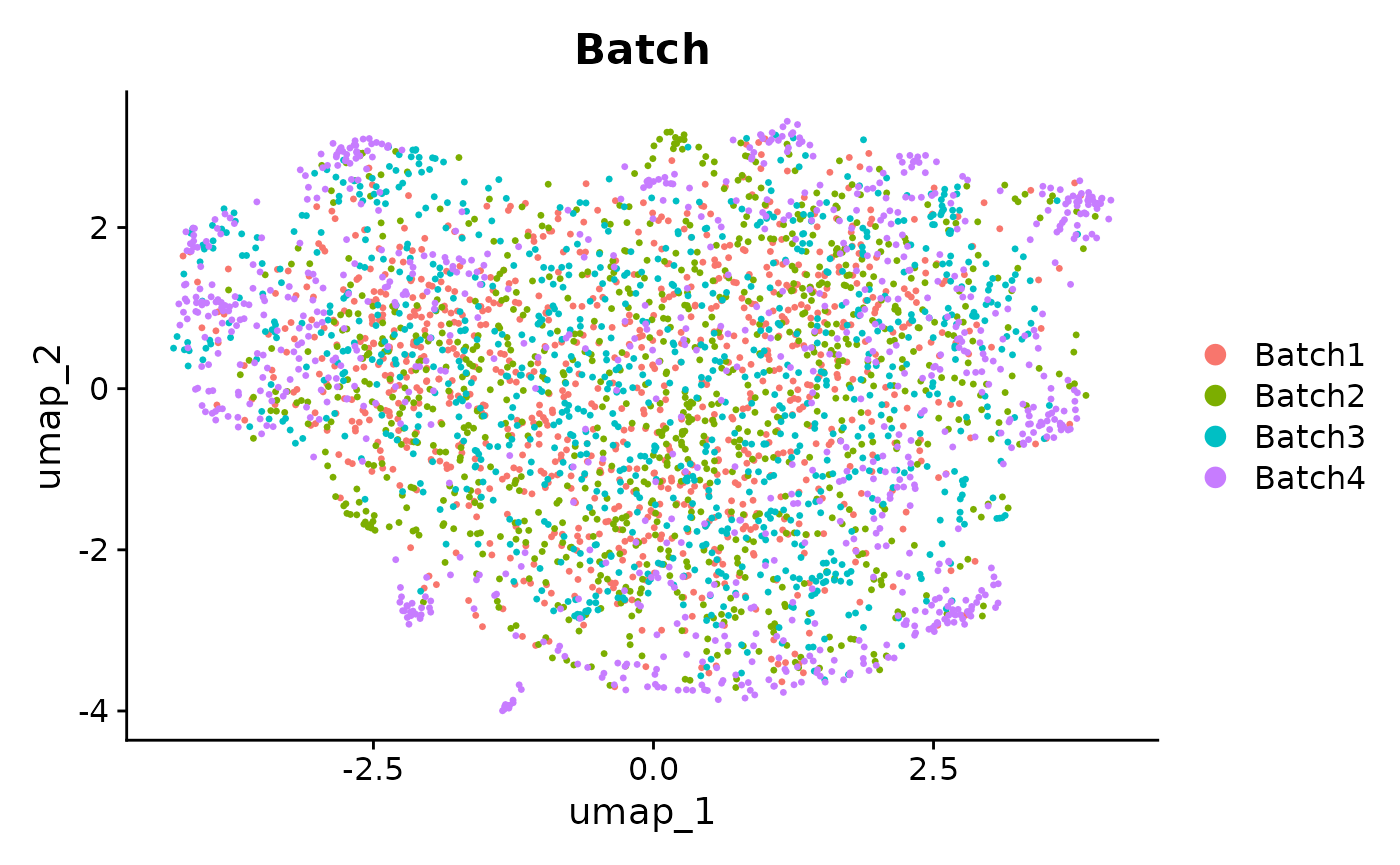
using 2000 HVGs
get HVGs
hvg_features <- Seurat::SelectIntegrationFeatures(se_list, nfeatures = 2000)## No variable features found for object1 in the object.list. Running FindVariableFeatures ...## Finding variable features for layer counts## No variable features found for object2 in the object.list. Running FindVariableFeatures ...## Finding variable features for layer counts## No variable features found for object3 in the object.list. Running FindVariableFeatures ...## Finding variable features for layer counts## No variable features found for object4 in the object.list. Running FindVariableFeatures ...## Finding variable features for layer counts
suppressWarnings({
  seurat_integrated_hvg_2000 <- integrate_seurat_list(se_list,
    features = hvg_features,
    process = TRUE
  )
})
## Log normalizing data...## Finding integration anchors...## Integrating samples...## Running PCA with 30 PCs## Running UMAP with 30 PCs and 30 neighbors
seurat_integrated_hvg_2000## An object of class Seurat
## 7000 features across 3600 samples within 2 assays
## Active assay: integrated (2000 features, 2000 variable features)
## 2 layers present: data, scale.data
## 1 other assay present: RNA
## 2 dimensional reductions calculated: pca, umapplot integration
Seurat::DimPlot(seurat_integrated_hvg_2000, reduction = "umap", group.by = "Batch")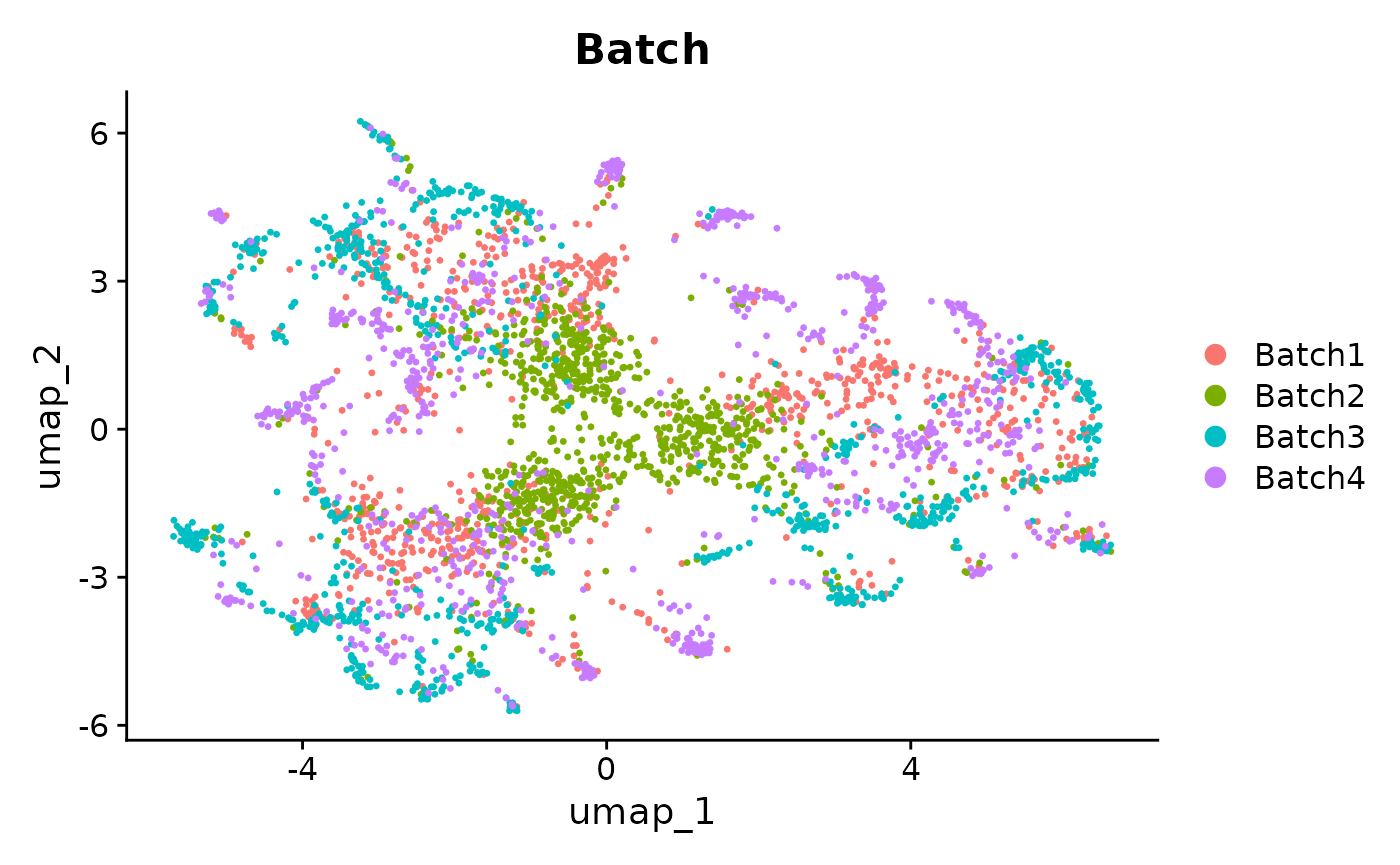
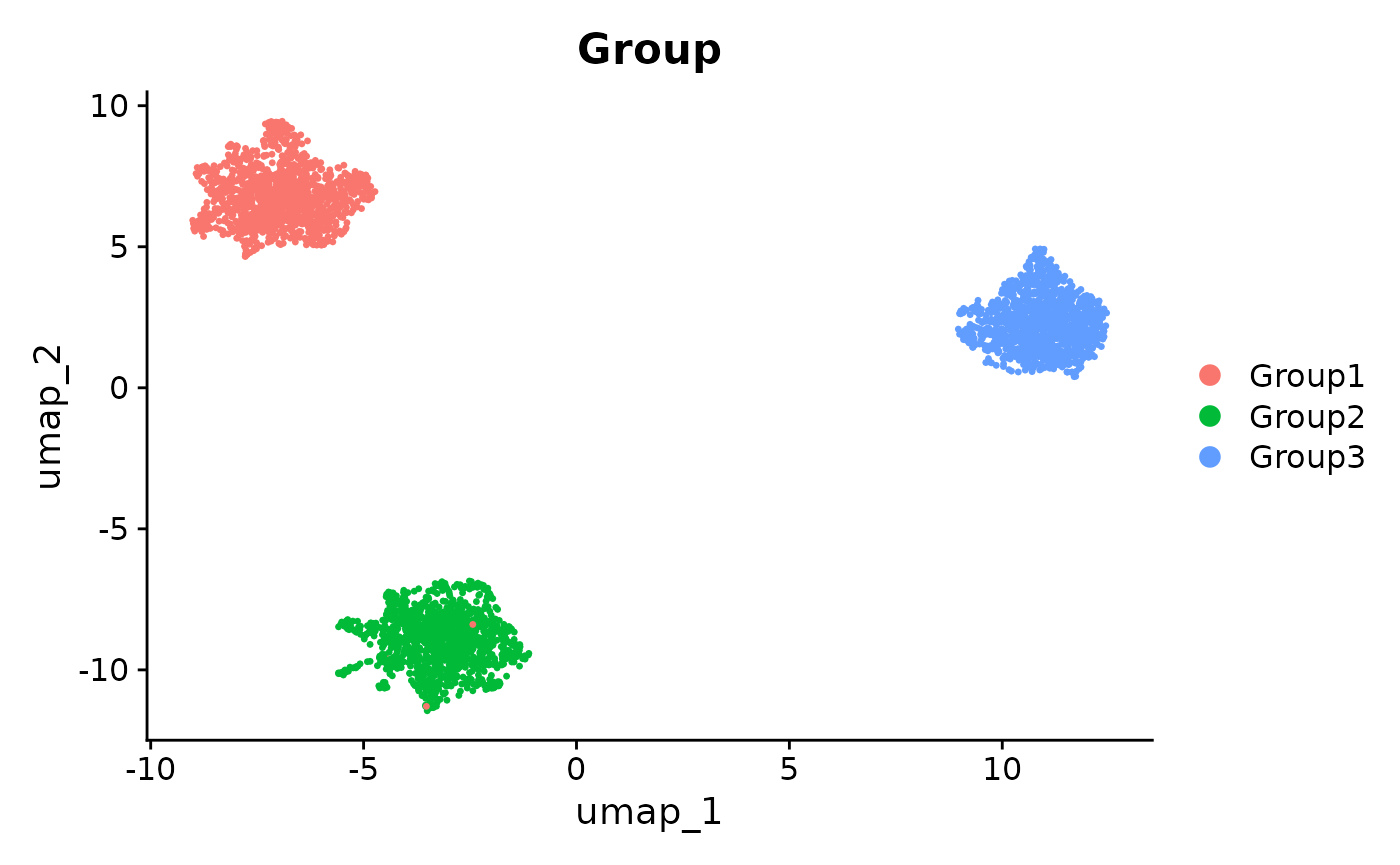
Seurat::DimPlot(seurat_integrated_hvg_2000, reduction = "umap", group.by = "Group")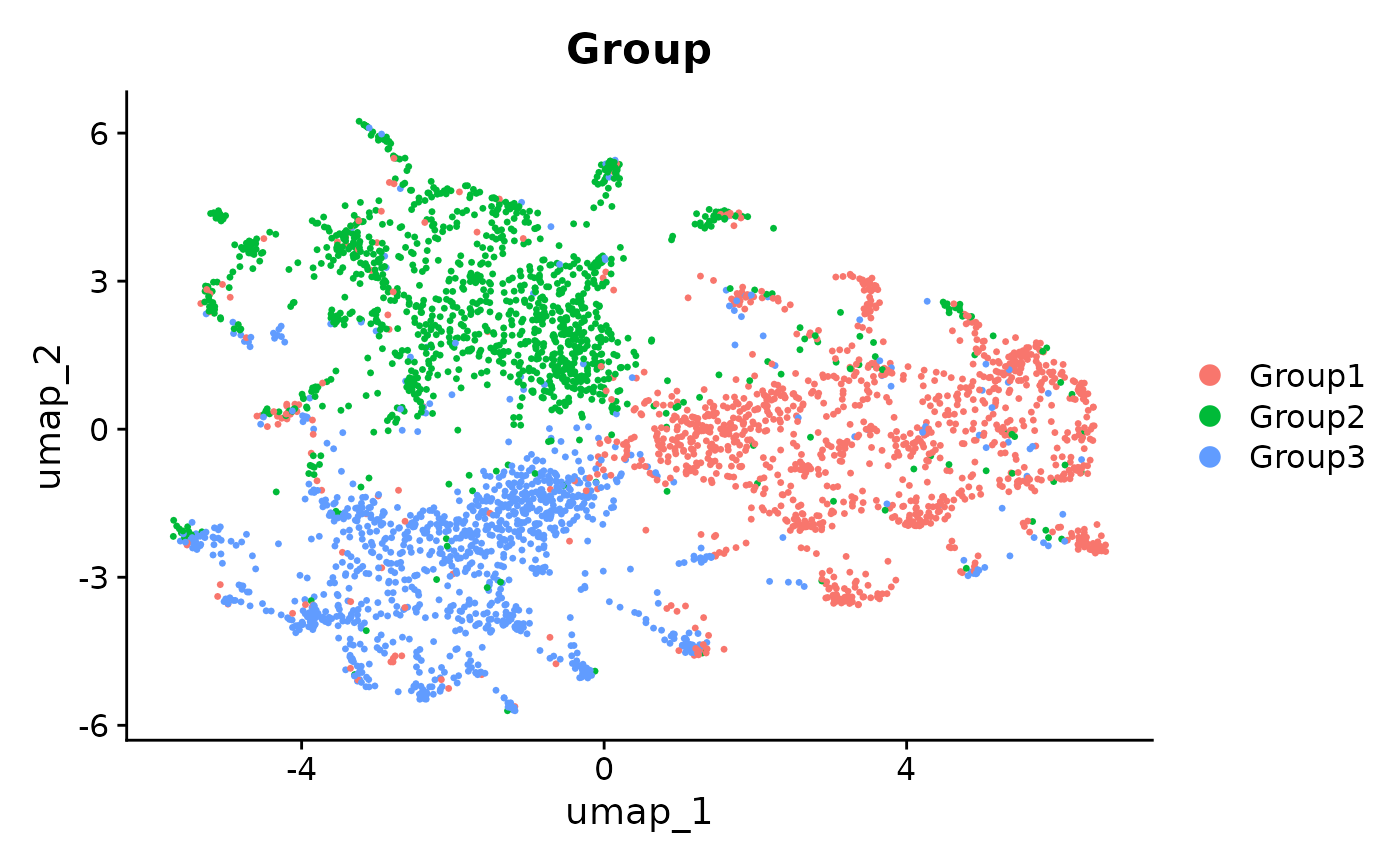
## R version 4.5.0 (2025-04-11)
## Platform: x86_64-pc-linux-gnu
## Running under: Ubuntu 24.04.2 LTS
##
## Matrix products: default
## BLAS:   /usr/lib/x86_64-linux-gnu/openblas-pthread/libblas.so.3
## LAPACK: /usr/lib/x86_64-linux-gnu/openblas-pthread/libopenblasp-r0.3.26.so;  LAPACK version 3.12.0
##
## locale:
##  [1] LC_CTYPE=C.UTF-8       LC_NUMERIC=C           LC_TIME=C.UTF-8
##  [4] LC_COLLATE=C.UTF-8     LC_MONETARY=C.UTF-8    LC_MESSAGES=C.UTF-8
##  [7] LC_PAPER=C.UTF-8       LC_NAME=C              LC_ADDRESS=C
## [10] LC_TELEPHONE=C         LC_MEASUREMENT=C.UTF-8 LC_IDENTIFICATION=C
##
## time zone: UTC
## tzcode source: system (glibc)
##
## attached base packages:
## [1] stats4    stats     graphics  grDevices utils     datasets  methods
## [8] base
##
## other attached packages:
##  [1] future_1.49.0               splatter_1.32.0
##  [3] SingleCellExperiment_1.30.1 SummarizedExperiment_1.38.1
##  [5] Biobase_2.68.0              GenomicRanges_1.60.0
##  [7] GenomeInfoDb_1.44.0         IRanges_2.42.0
##  [9] S4Vectors_0.46.0            BiocGenerics_0.54.0
## [11] generics_0.1.4              MatrixGenerics_1.20.0
## [13] matrixStats_1.5.0           Seurat_5.3.0
## [15] SeuratObject_5.1.0          sp_2.2-0
## [17] dplyr_1.1.4                 anglemania_0.99.3
##
## loaded via a namespace (and not attached):
##   [1] RColorBrewer_1.1-3      jsonlite_2.0.0          magrittr_2.0.3
##   [4] spatstat.utils_3.1-3    farver_2.1.2            rmarkdown_2.29
##   [7] fs_1.6.6                ragg_1.4.0              vctrs_0.6.5
##  [10] ROCR_1.0-11             spatstat.explore_3.4-2  S4Arrays_1.8.0
##  [13] htmltools_0.5.8.1       SparseArray_1.8.0       sass_0.4.10
##  [16] sctransform_0.4.2       parallelly_1.44.0       KernSmooth_2.23-26
##  [19] bslib_0.9.0             htmlwidgets_1.6.4       desc_1.4.3
##  [22] ica_1.0-3               plyr_1.8.9              plotly_4.10.4
##  [25] zoo_1.8-14              cachem_1.1.0            igraph_2.1.4
##  [28] iterators_1.0.14        mime_0.13               lifecycle_1.0.4
##  [31] pkgconfig_2.0.3         Matrix_1.7-3            R6_2.6.1
##  [34] fastmap_1.2.0           GenomeInfoDbData_1.2.14 fitdistrplus_1.2-2
##  [37] shiny_1.10.0            digest_0.6.37           ps_1.9.1
##  [40] patchwork_1.3.0         tensor_1.5              RSpectra_0.16-2
##  [43] irlba_2.3.5.1           rmio_0.4.0              textshaping_1.0.1
##  [46] labeling_0.4.3          progressr_0.15.1        spatstat.sparse_3.1-0
##  [49] httr_1.4.7              polyclip_1.10-7         abind_1.4-8
##  [52] compiler_4.5.0          withr_3.0.2             doParallel_1.0.17
##  [55] backports_1.5.0         BiocParallel_1.42.0     fastDummies_1.7.5
##  [58] bigassertr_0.1.6        MASS_7.3-65             DelayedArray_0.34.1
##  [61] tools_4.5.0             bigstatsr_1.6.1         lmtest_0.9-40
##  [64] httpuv_1.6.16           future.apply_1.11.3     goftest_1.2-3
##  [67] glue_1.8.0              nlme_3.1-168            promises_1.3.2
##  [70] bigparallelr_0.3.2      grid_4.5.0              checkmate_2.3.2
##  [73] Rtsne_0.17              cluster_2.1.8.1         reshape2_1.4.4
##  [76] gtable_0.3.6            spatstat.data_3.1-6     flock_0.7
##  [79] tidyr_1.3.1             data.table_1.17.2       XVector_0.48.0
##  [82] spatstat.geom_3.3-6     RcppAnnoy_0.0.22        foreach_1.5.2
##  [85] ggrepel_0.9.6           RANN_2.6.2              pillar_1.10.2
##  [88] stringr_1.5.1           spam_2.11-1             RcppHNSW_0.6.0
##  [91] later_1.4.2             splines_4.5.0           lattice_0.22-6
##  [94] bit_4.6.0               survival_3.8-3          deldir_2.0-4
##  [97] tidyselect_1.2.1        locfit_1.5-9.12         miniUI_0.1.2
## [100] pbapply_1.7-2           knitr_1.50              gridExtra_2.3
## [103] scattermore_1.2         xfun_0.52               UCSC.utils_1.4.0
## [106] stringi_1.8.7           lazyeval_0.2.2          yaml_2.3.10
## [109] evaluate_1.0.3          codetools_0.2-20        tibble_3.2.1
## [112] cli_3.6.5               uwot_0.2.3              xtable_1.8-4
## [115] reticulate_1.42.0       systemfonts_1.2.3       jquerylib_0.1.4
## [118] Rcpp_1.0.14             globals_0.18.0          spatstat.random_3.3-3
## [121] png_0.1-8               spatstat.univar_3.1-3   parallel_4.5.0
## [124] pkgdown_2.1.2           ggplot2_3.5.2           dotCall64_1.2
## [127] ff_4.5.2                listenv_0.9.1           viridisLite_0.4.2
## [130] scales_1.4.0            ggridges_0.5.6          crayon_1.5.3
## [133] purrr_1.0.4             rlang_1.1.6             cowplot_1.1.3